Interactive Figma Dashboard
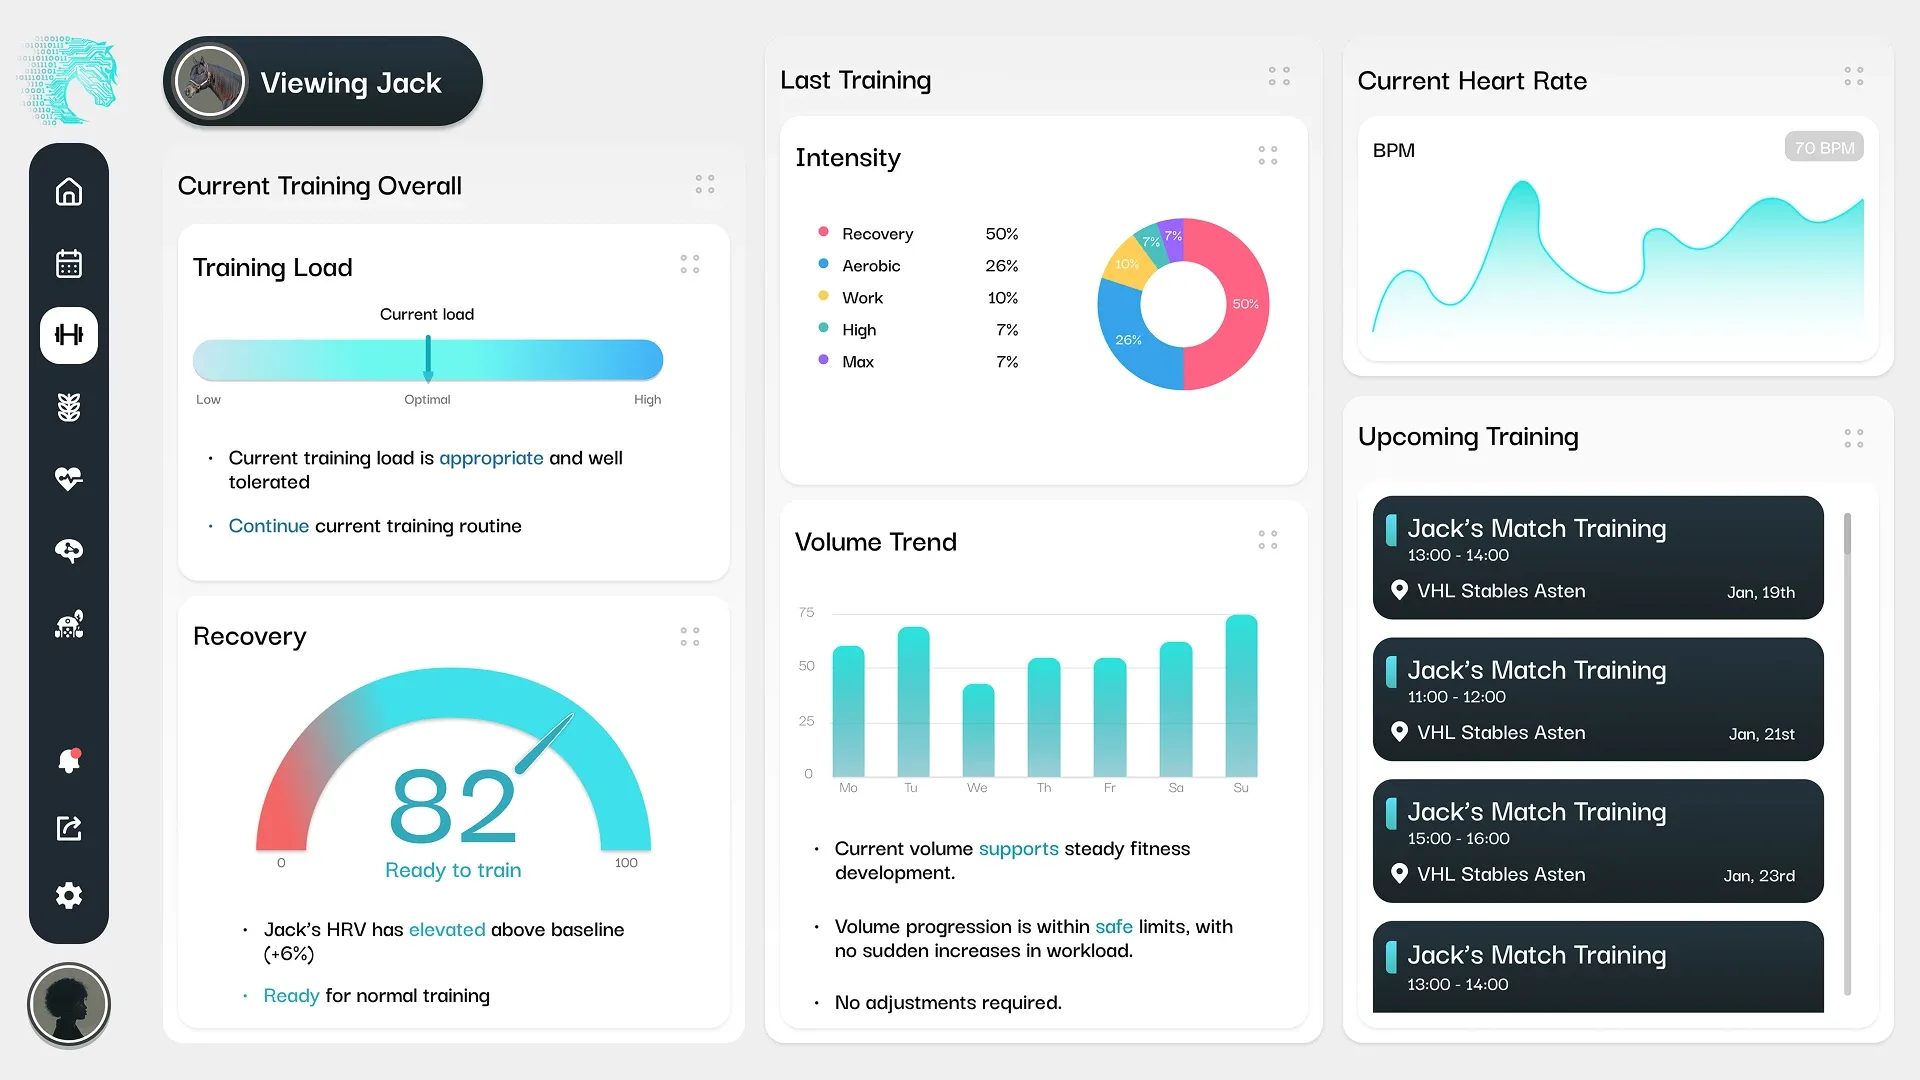
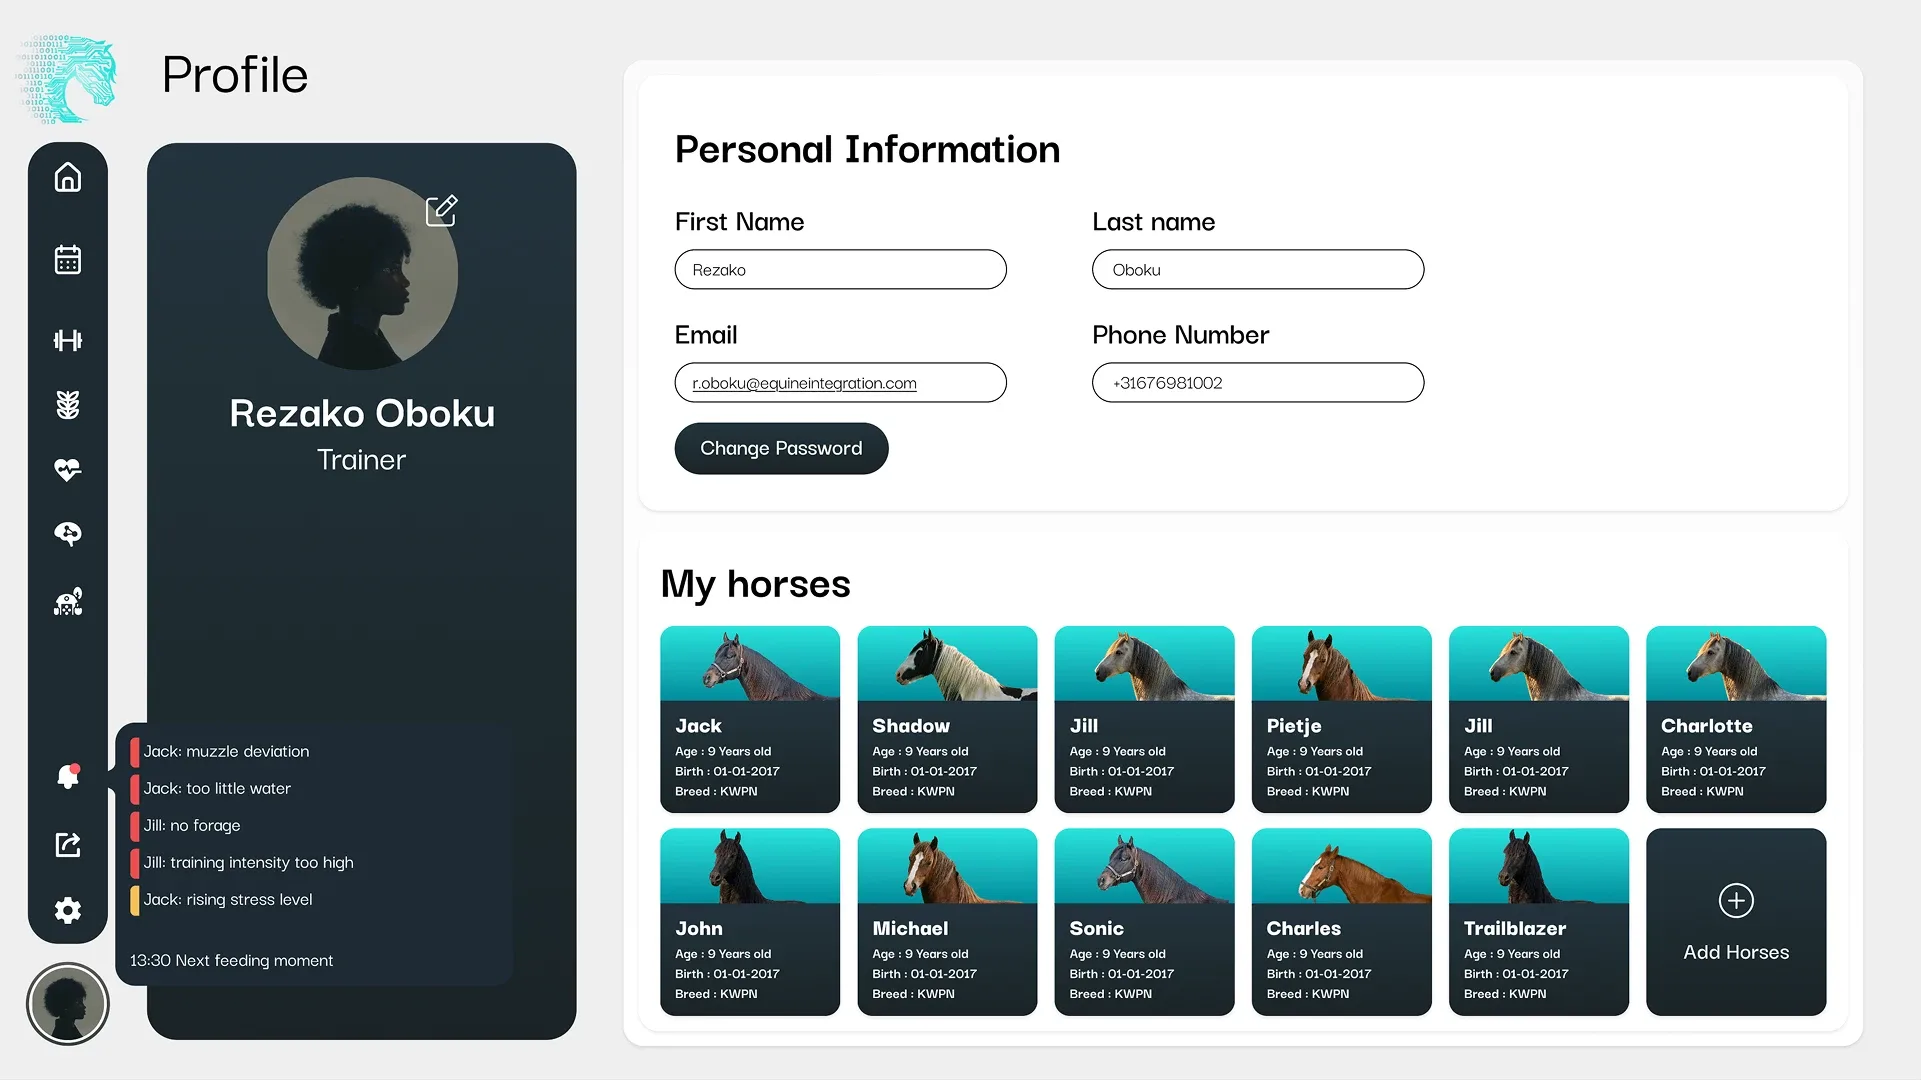
An interactive Figma dashboard that gives high-performance trainers and athletes in the equine world an aggregated, yet detailed central view of their data.
- Client
- Equine Integration
- Year
- 2025–2026
- Role
- Group Leader, UX/UI Designer
- Tools
- Figma
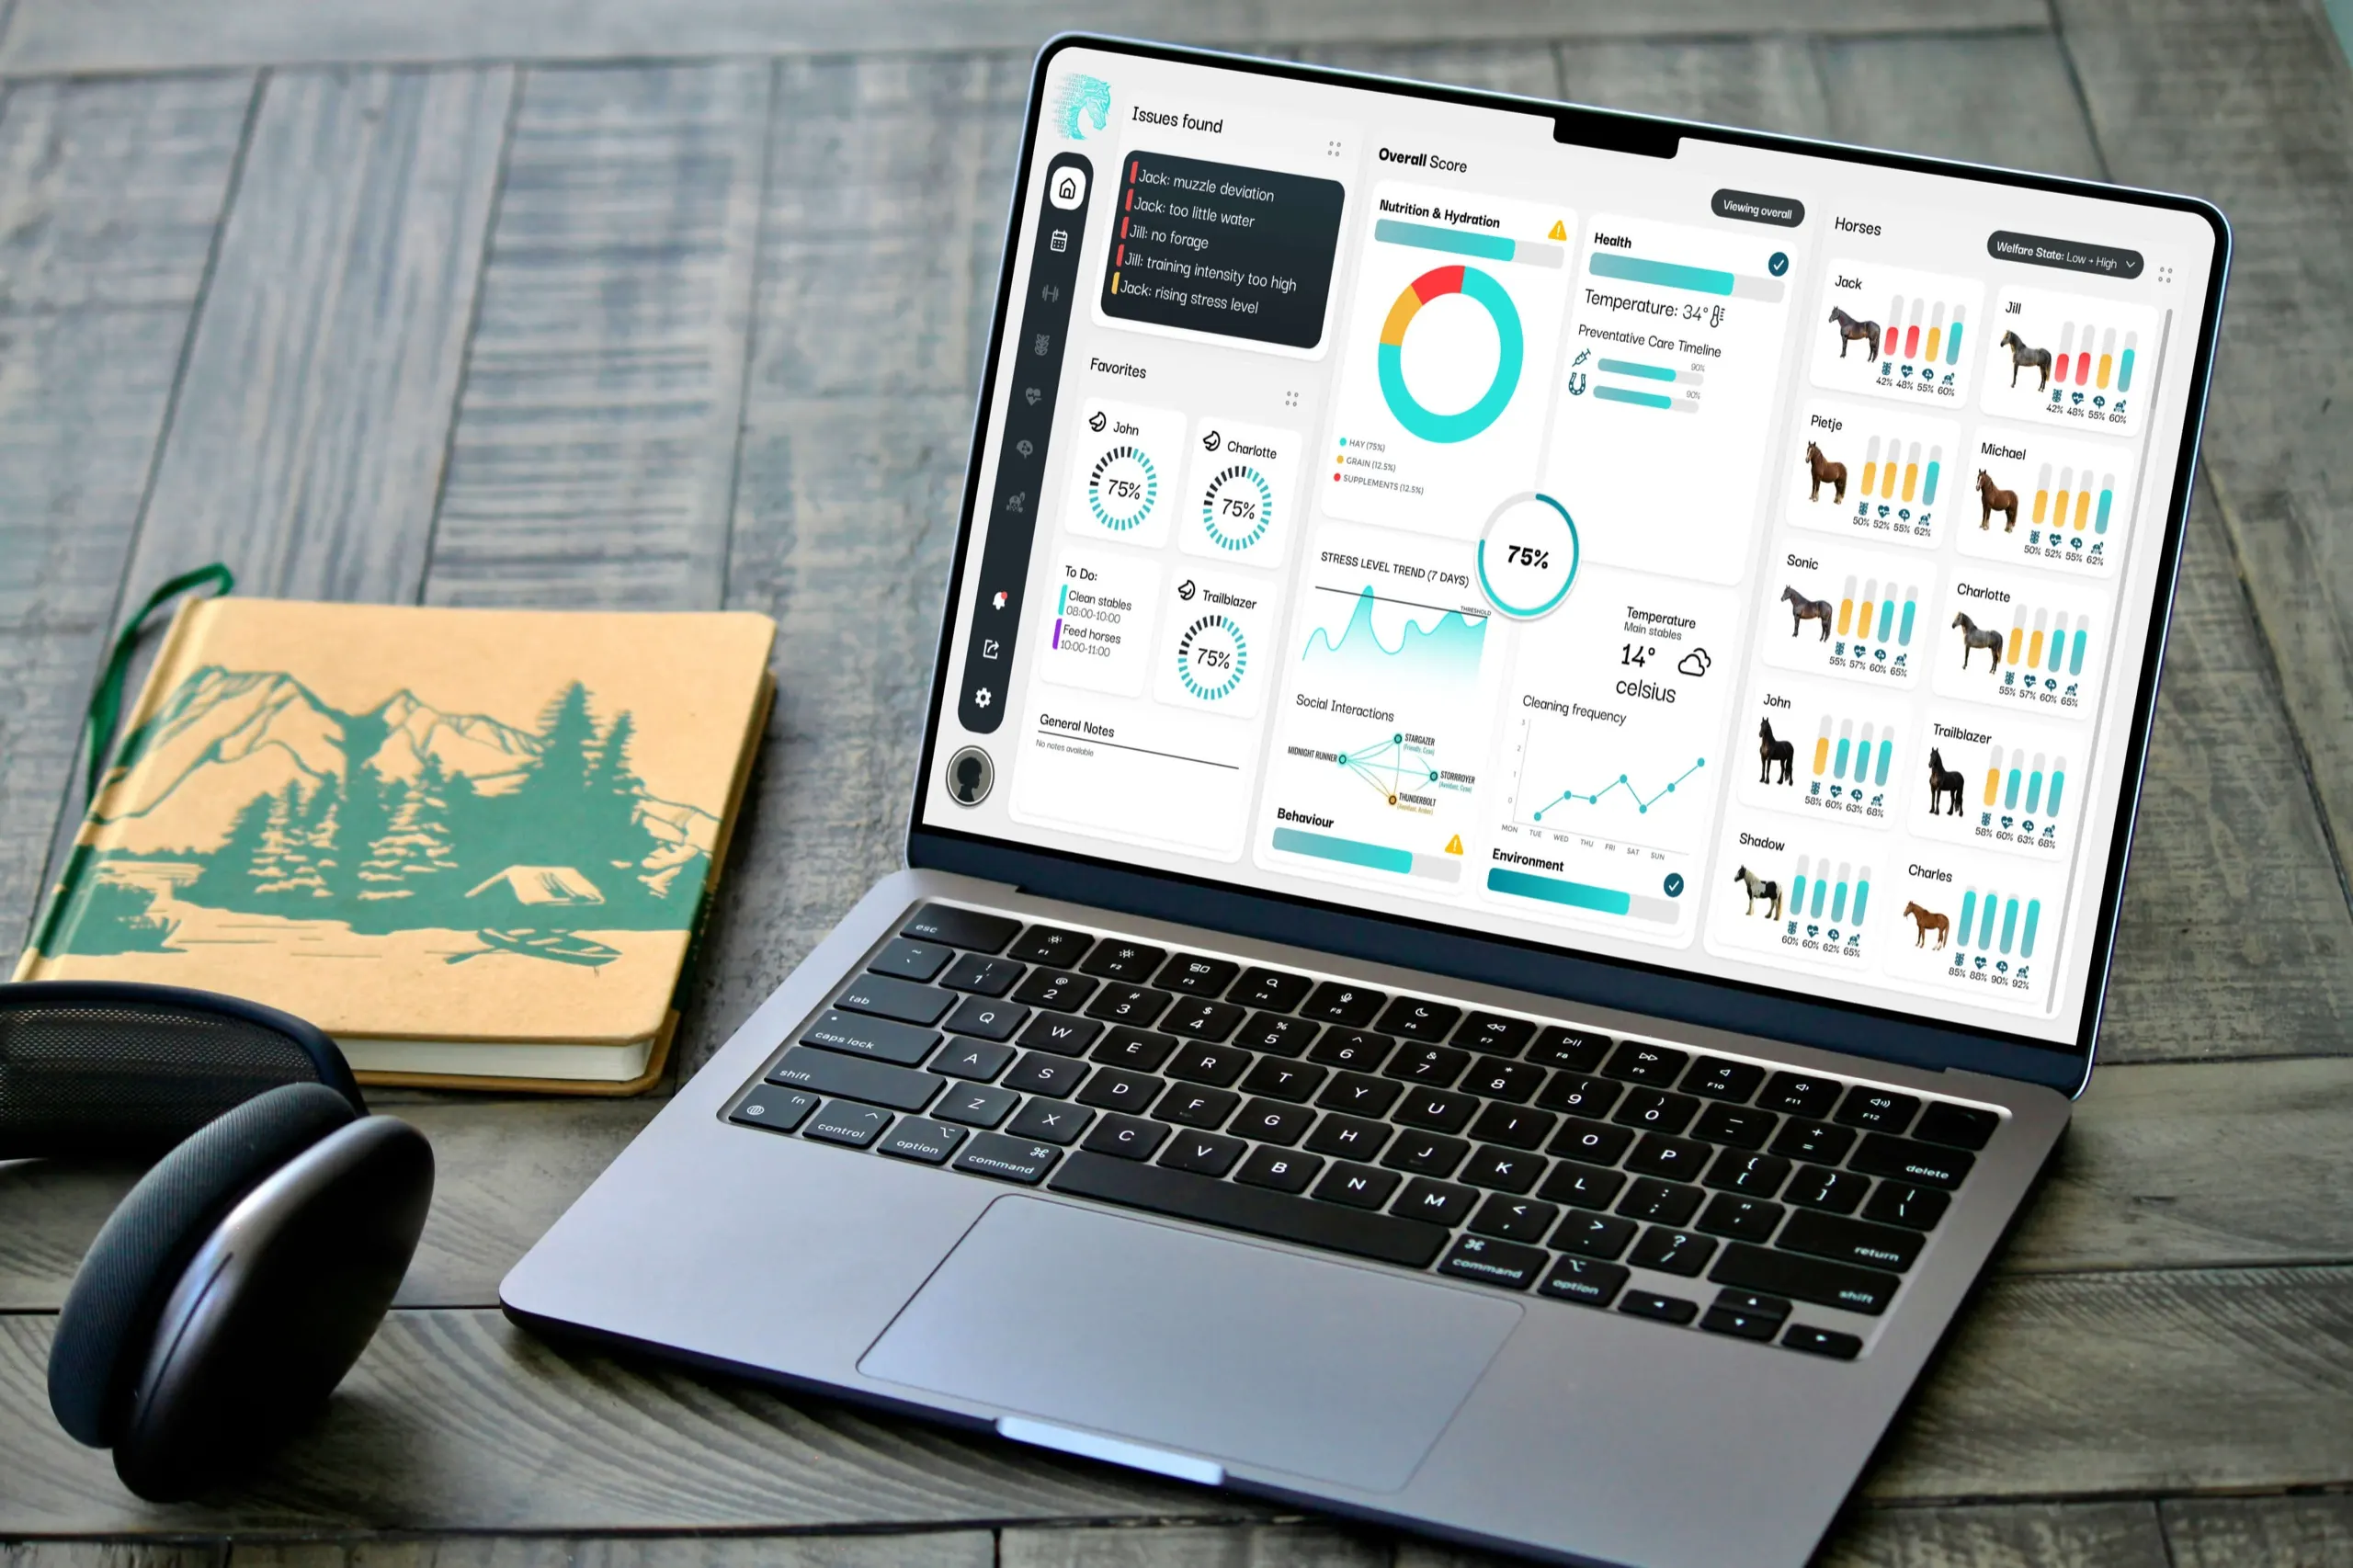
The audience spanned from the individual amateur riders to The Federation Equestre Internationale (FEI), all with very different needs. We researched it, distilled it into a clear target group, and designed a dashboard that shows both the overview and the detail in a modern, accessible way.
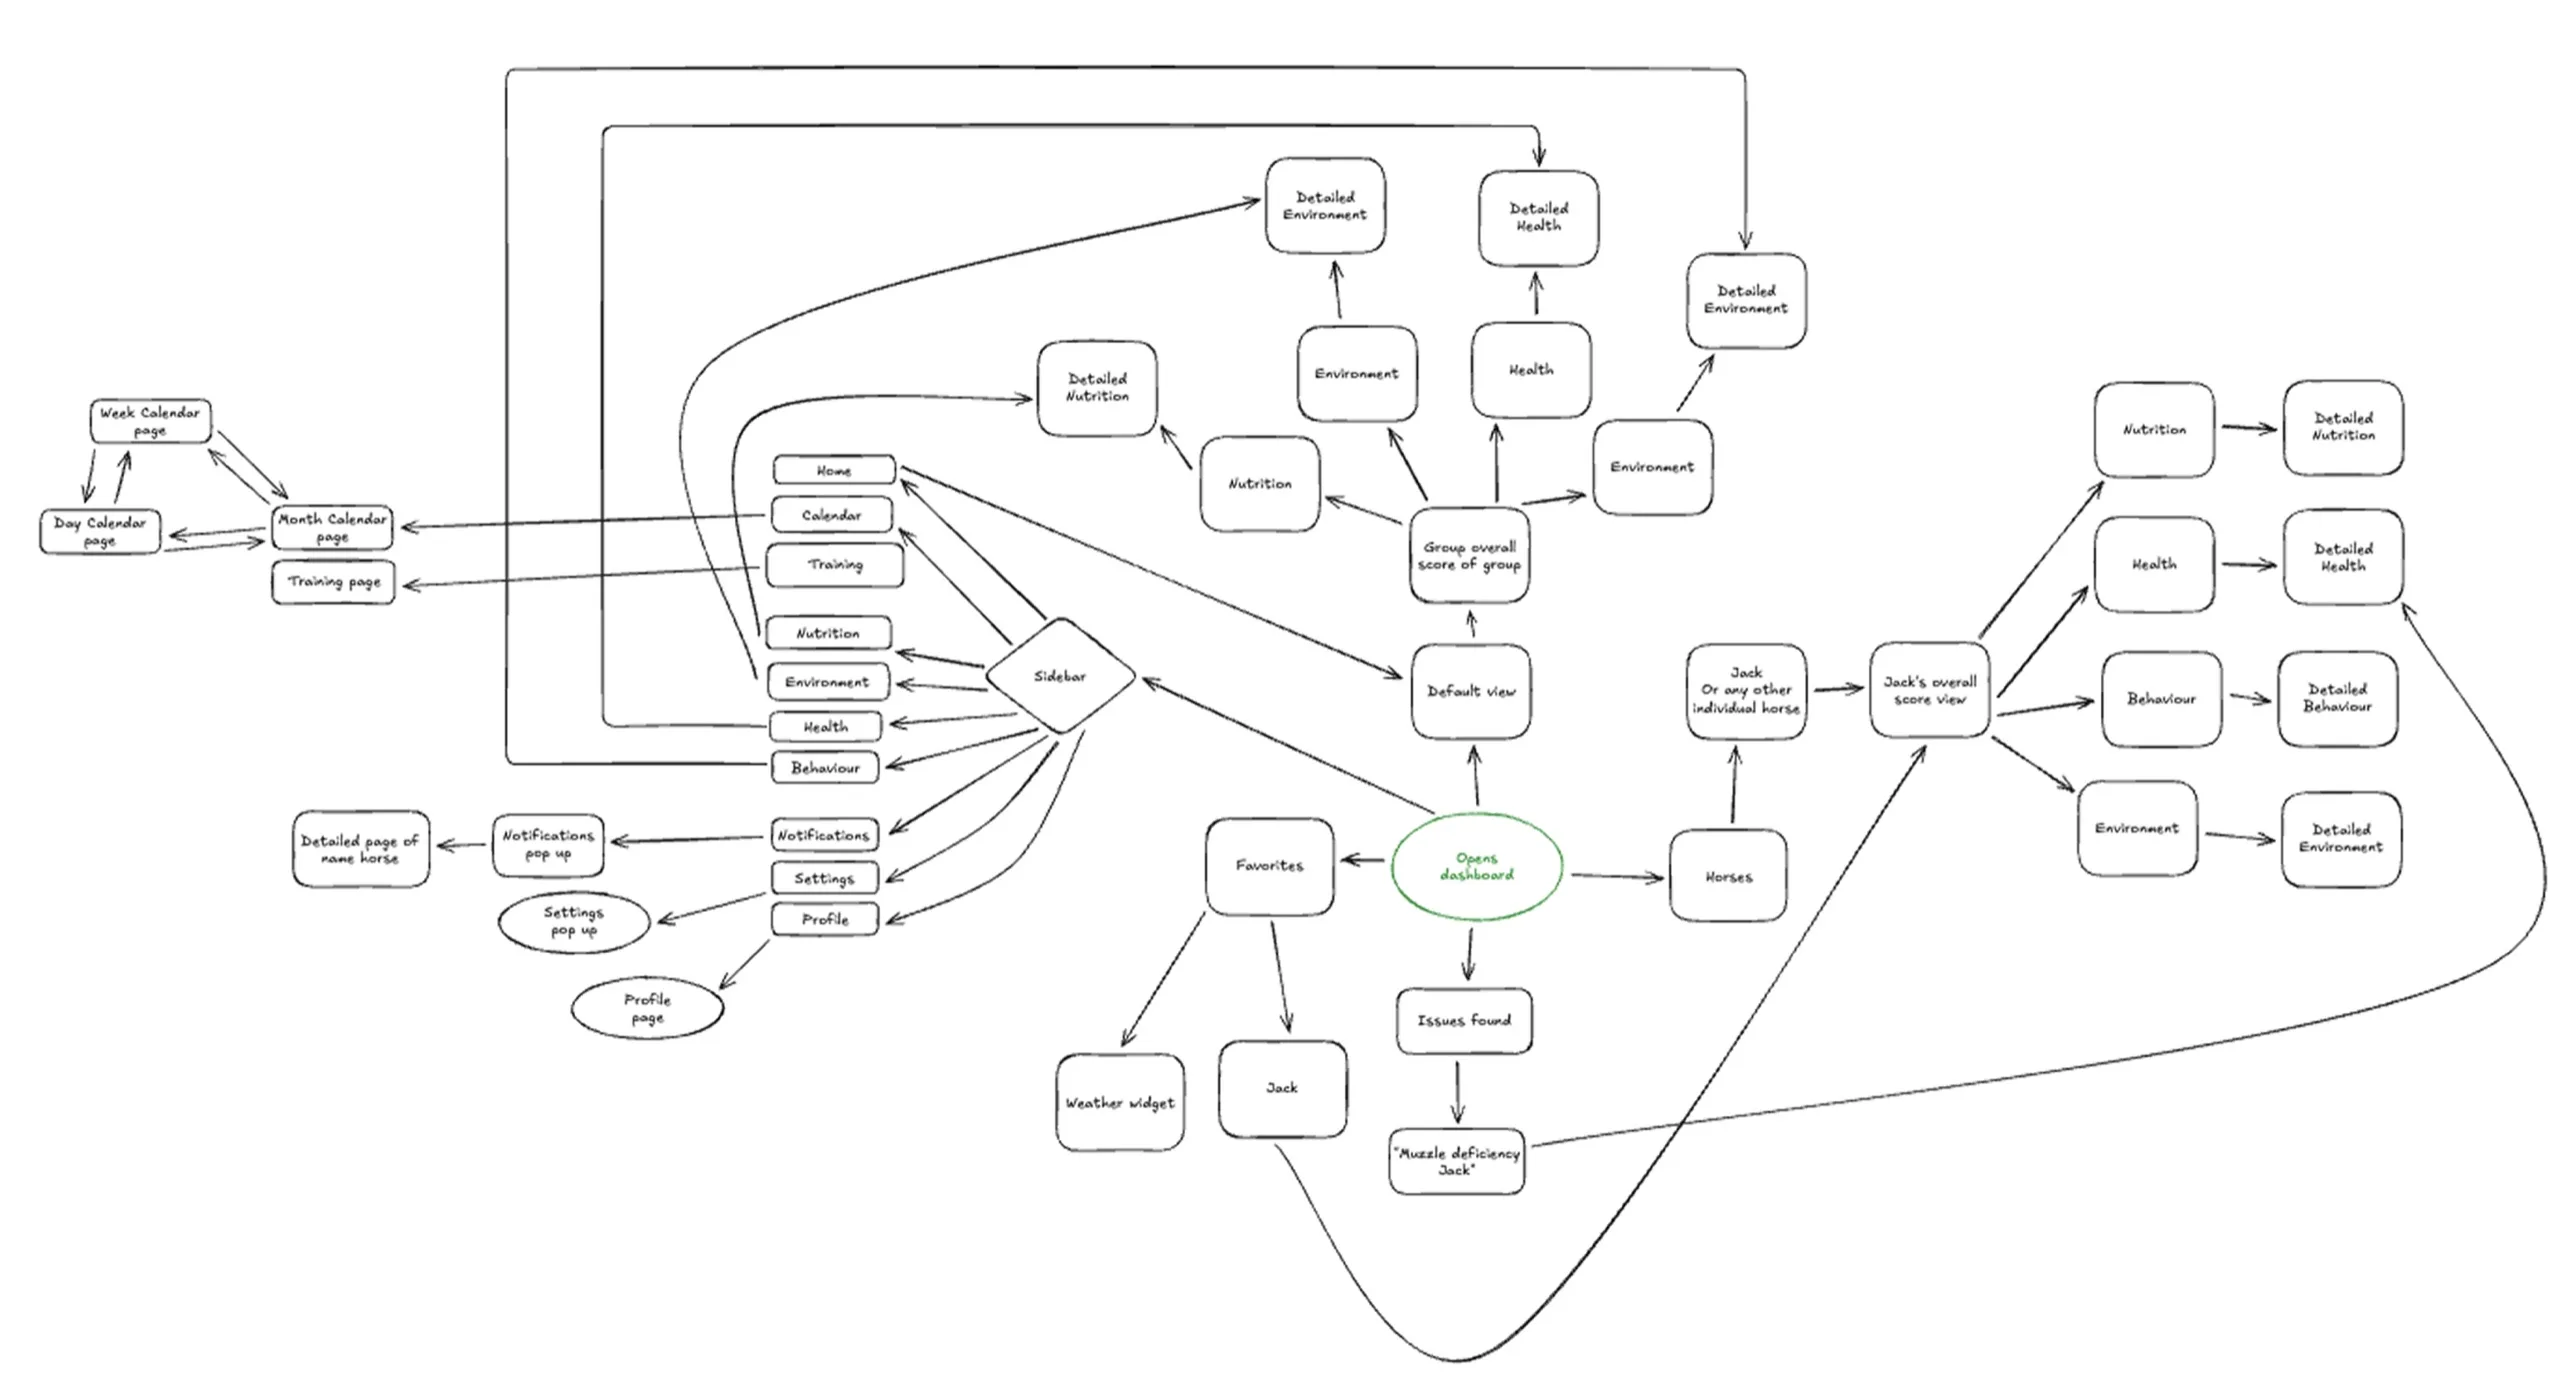
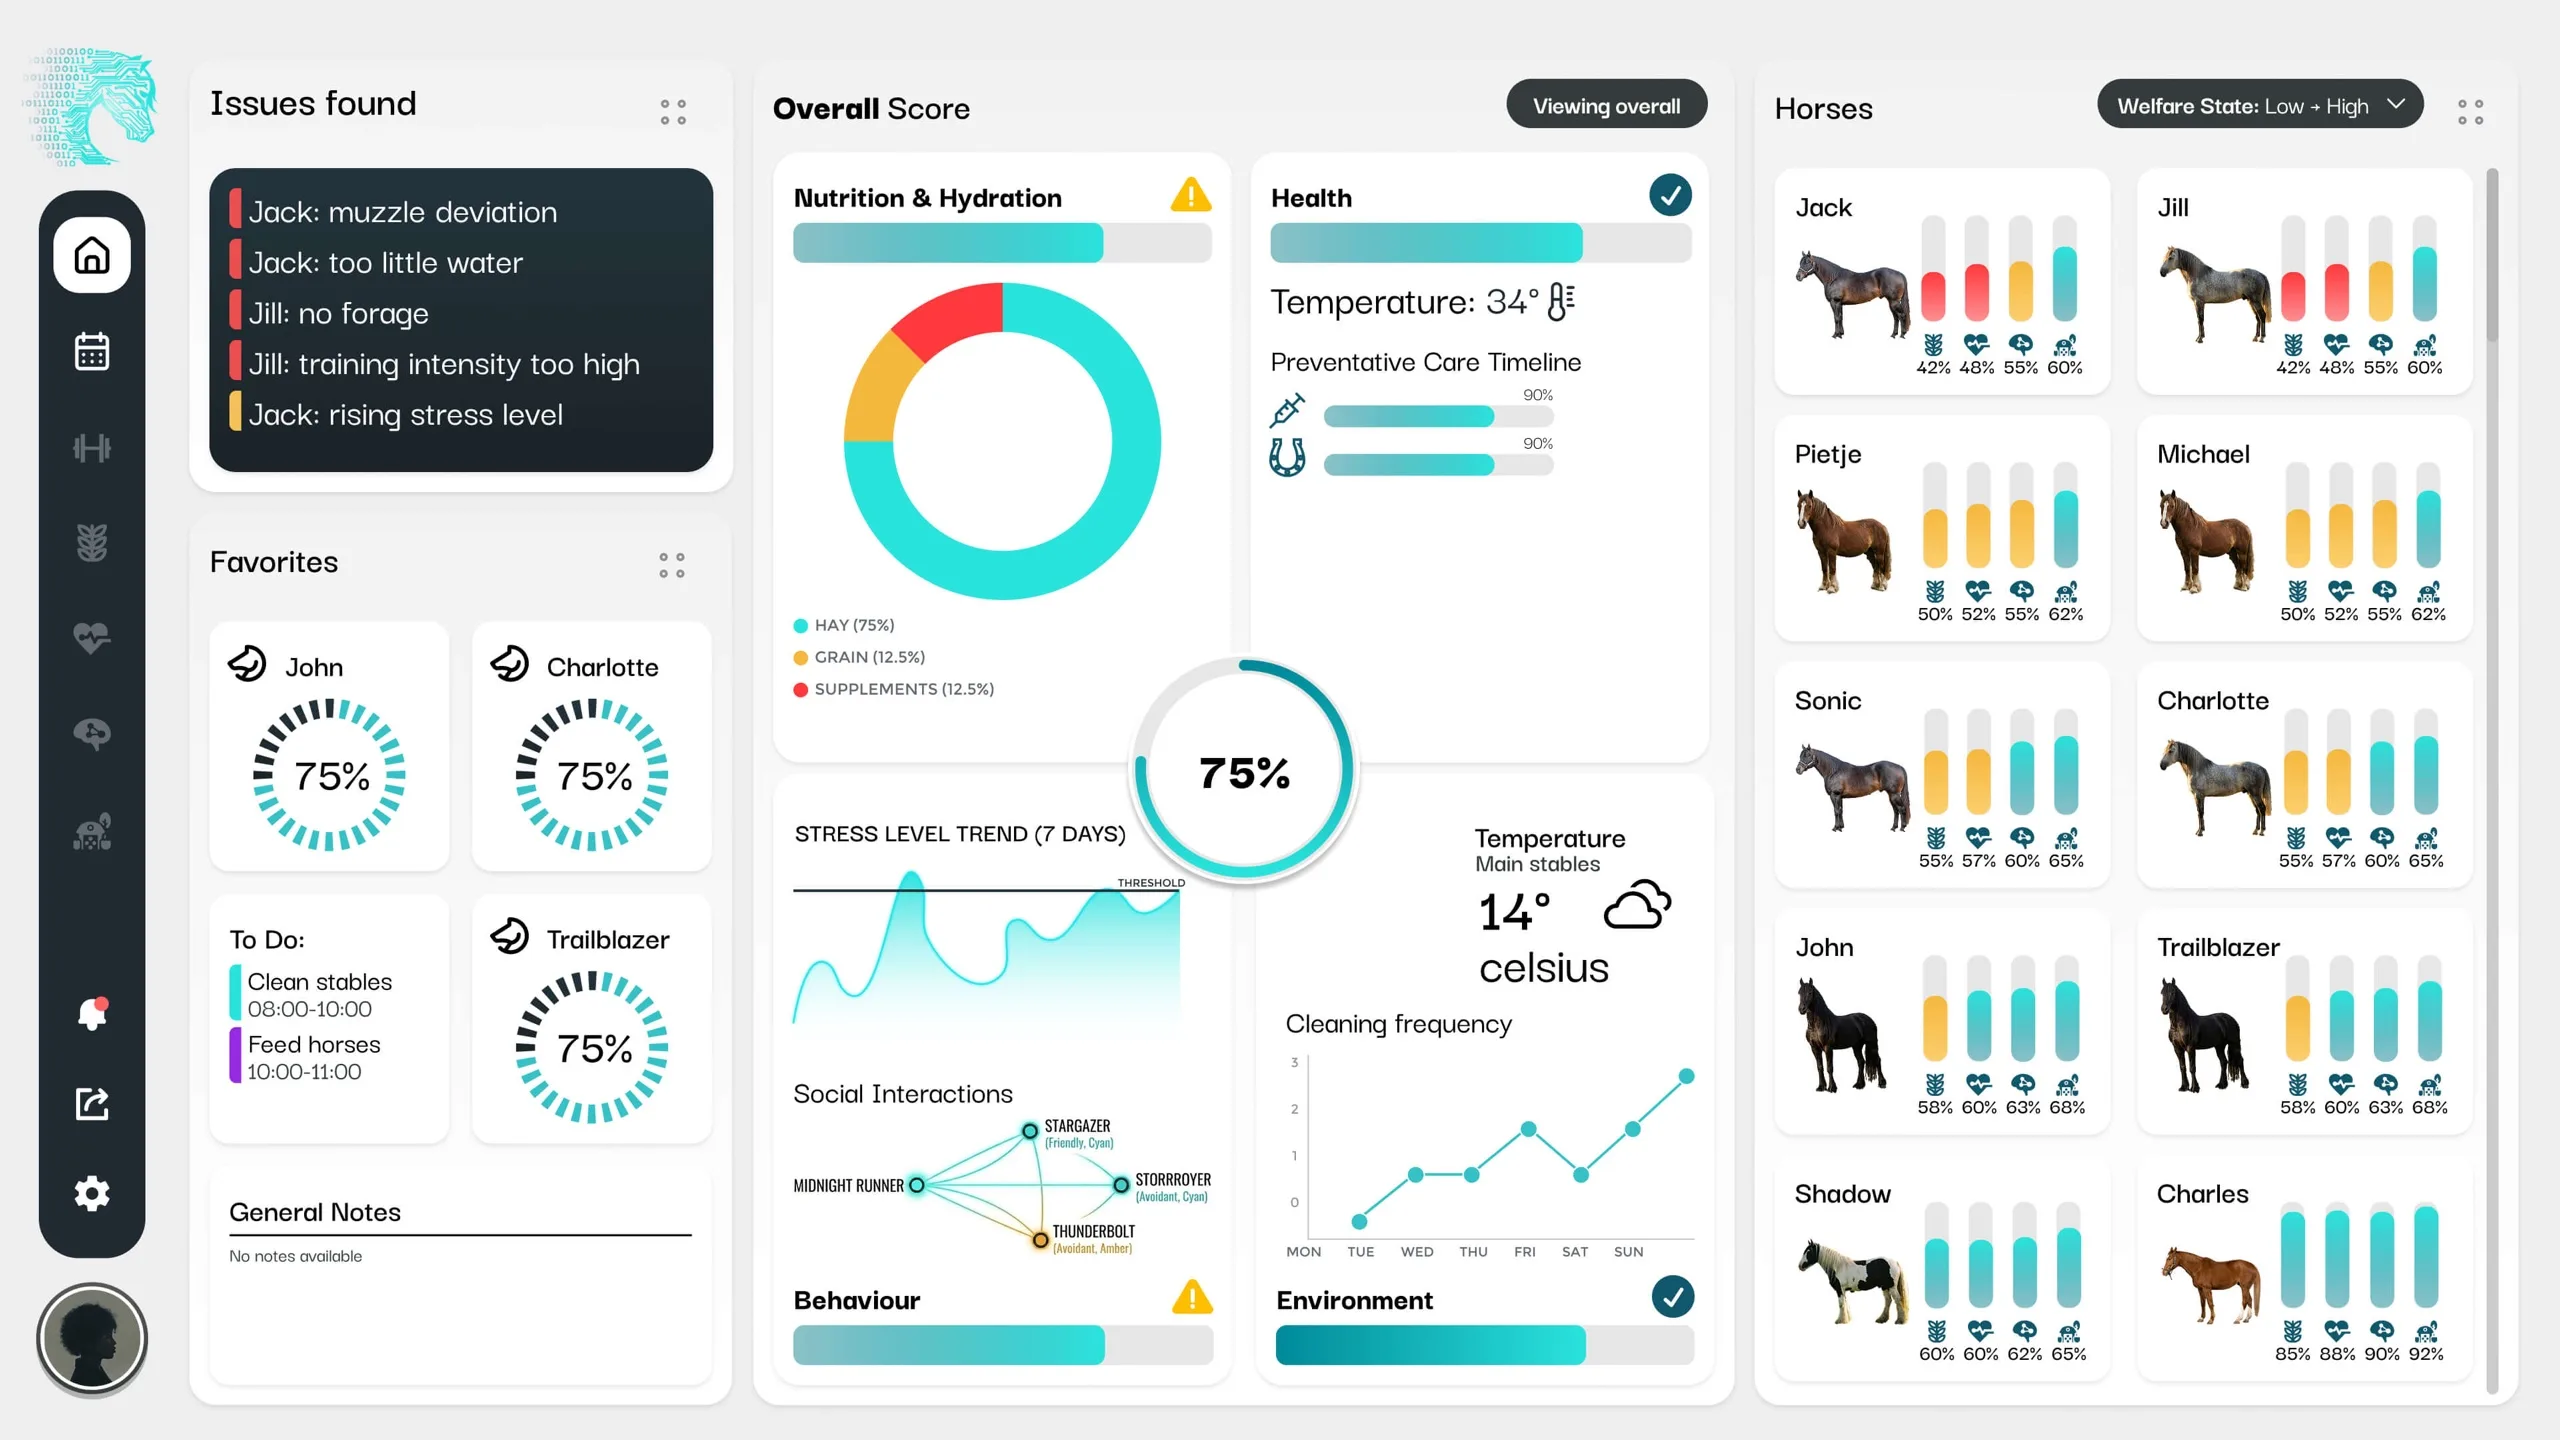
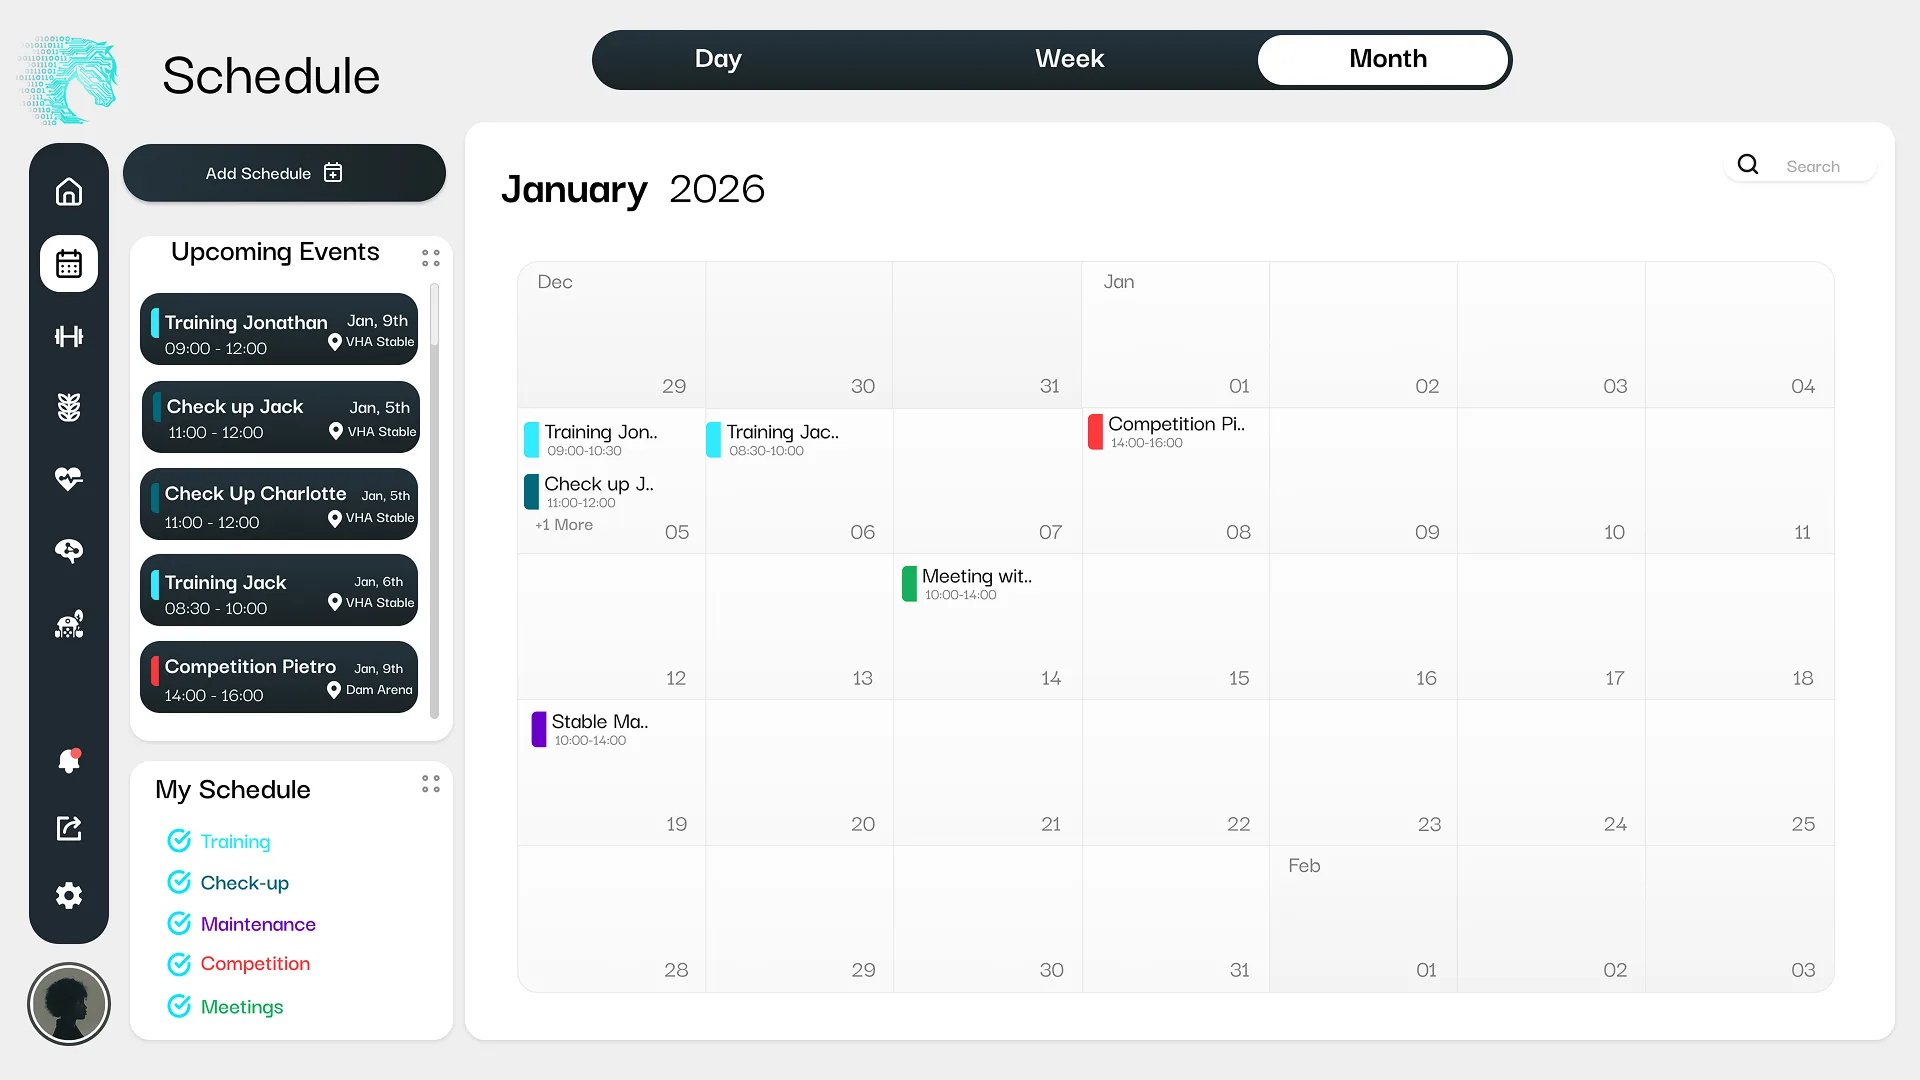
Result
Delivered as a complete, interactive Figma prototype containing both the aggregated overview and detailed screens, ready to hand to a development team.